
3 min read
569 words
Are you looking for amazing infographic ideas to add to your content? Infographics are amazing to add to your blog or website. They look polished and professional, grab the reader’s attention, and give the information easily to the reader. However, coming up with the best infographic templates can be difficult sometimes. So, what do you do? Keep reading to learn how to create a list of awesome ideas to post on your website!
- Timeline Infographic
A timeline infographic is a visually appealing way to present a series of events in chronological order. It provides a clear overview of the timeline and allows viewers to understand the progression of a specific topic.
Use a horizontal or vertical layout with clearly marked dates along the timeline. Include illustrations, icons, or images to represent each event, making it visually engaging. Consider using different colors or icons to categorize events or highlight key milestones.
Whether it’s showcasing historical events, the evolution of a product, or a company’s growth, an Adobe Express infographic timeline offers a comprehensive and concise presentation.
- Comparison Infographic
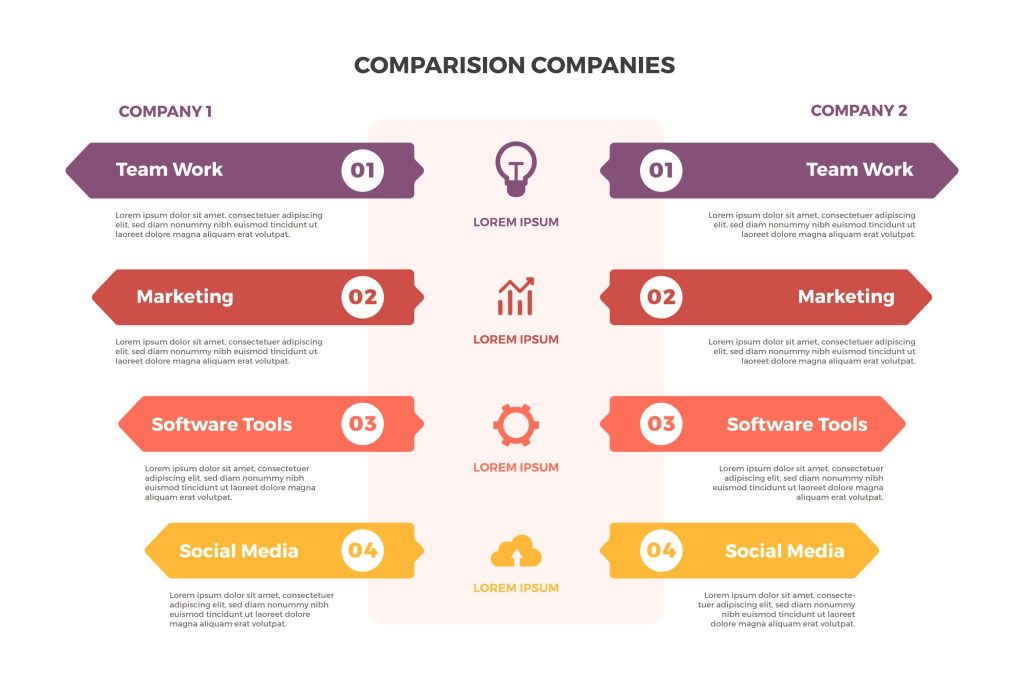
A comparison infographic is a good way to show how two or more things, ideas, or concepts are alike and how they are different. It compares two things, making it easy for people to see their differences.
Use a clear layout with different headings and sections for each thing you are comparing. Use icons, illustrations, or pictures to show each part and make the comparison more interesting.
- Process Infographic
A process infographic breaks down a complex procedure or workflow into simple, easy-to-follow steps. It provides a visual representation of each stage, making it easier for viewers to understand and follow along. Use a sequential layout, with each step numbered or labeled.
Incorporate icons, illustrations, or images to represent each stage and enhance visual comprehension. Use concise and descriptive text to explain each step and ensure clarity.
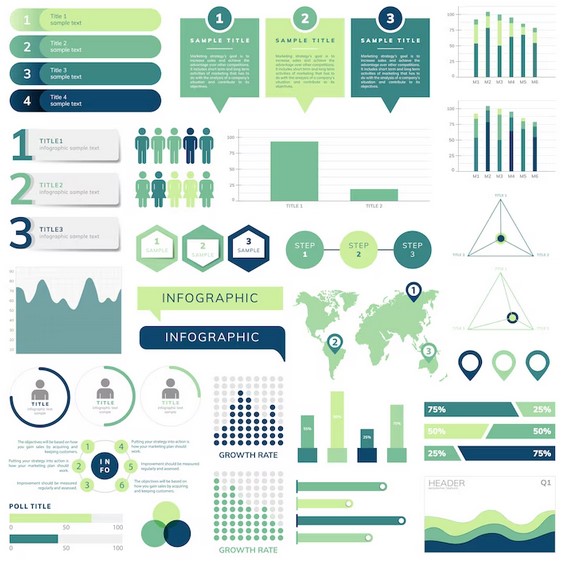
- Statistical Infographic
A statistical infographic shows data and statistics in a way that is interesting and easy to understand. It does a good job of showing numerical information using charts, graphs, and diagrams.
Depending on the data being shown, choose the best type of chart or graph, such as a bar chart, pie chart, line graph, or scatter plot. Use elements with different colors, clear labels, and short titles to make the information easy to understand. Add icons, illustrations, or images to give context or highlight key points.
- Storytelling Infographic
A storytelling infographic uses text, images, and icons to tell a story with the information it shows. It tells a story or gives information in a way that makes sense, which keeps people’s attention and makes the content more interesting.
Start with a catchy intro or headline that sets the tone for the rest of the story. Use a mix of text and images to lead people through the story, ensuring each part adds to the story being told.
Unleash Your Creativity With Captivating Infographic Ideas
Infographics are a powerful tool for businesses to convey complex information quickly and visually. They can also be a powerful tool for creating leads and conversions.
With these infographic ideas to get you started, you can engage your audience and convert them into customers. Try to make an infographic today and reap the rewards of great data visualization!
Did you find the information in this article useful? If so, make sure to check out our blog for more helpful resources.